Oceanic Salinity | महासागरीय जल की लवणता

Oceanic Salinity | महासागरीय जल की लवणता: महासागर की लवणता समुद्री जल में घुले हुए लवण की मात्रा को दर्शाती है। लवणता वह शब्द है जिसका उपयोग समुद्री जल में घुले हुए नमक की मात्रा को निर्धरित करने में किया जाता है। इसका परिकलन 1,000 ग्राम॰ या एक किलोग्राम समुद्री जल में घुले हुए नमक ग्राम में की मात्रा द्वारा किया जाता है। इसे प्रायः प्रति 1,000 भाग या पीपीटी के रूप में व्यक्त किया जाता है। लवणता समुद्री जल का महत्वपूर्ण गुण है। 24.7 प्रति हजार की लवणता को खारे जल को सीमांकित करने का उच्च सीमा माना गया है।

Oceanic Salinity: महासागरीय लवणता को प्रभावित करने वाले कारक

  1. महासागरों की सतह के जल की लवणता मुख्यतः वाष्पीकरण एवं वर्षण पर निर्भर करती है।
  2. तटीय क्षेत्रों में सतह के जल की लवणता नदियों के द्वारा लाए गए ताजे जल के द्वारा तथा धु्रवीय क्षेत्रों में बर्फ के जमने एवं पिघलने की क्रिया से सबसे अधिक प्रभावित होती है।
  3. पवन भी जल को एक क्षेत्र से दूसरे क्षेत्रों में स्थानांतरित करके लवणता को प्रभावित करती है।
  4. महासागरीय धाराएँ भी लवणता में भिन्नता उत्पन्न करने में सहयोग करती हैं। जल की लवणता, तापमान एवं घनत्व परस्पर संबंधित होते हैं। इसलिए, तापमान अथवा घनत्व में किसी भी प्रकार का परिवर्तन किसी क्षेत्रा की लवणता को प्रभावित करता है।

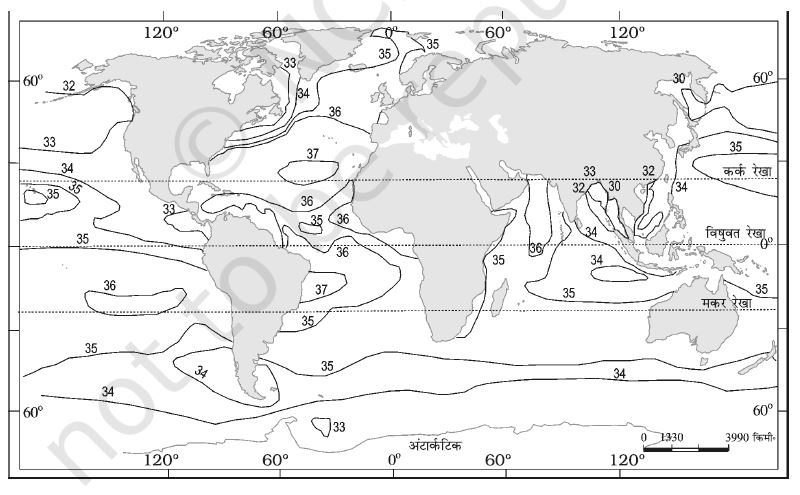
Oceanic Salinity: लवणता का क्षैतिज वितरण

Oceanic Salinity: सामान्य खुले महासागर की लवणता 33 से 37 प्रति हजार के बीच होती है। चारों तरफ स्थल से घिरे लाल सागर में यह 41 प्रति हजार तक होती हैंए जबकि आर्कटिक एवं ज्वार नद मुख में मौसम के अनुसार लवणता 0 से 35 प्रति हजार के बीच पाई जाती है। गर्म तथा शुष्क क्षेत्रों मेंए जहाँ वाष्पीकरण उच्च होता है कभी.कभी वहाँ की लवणता 70 प्रति हजार तक पहुँच जाती है। प्रशांत महासागर के लवणता में भिन्नता मुख्यतः इसके आकार एवं बहुत अधिक क्षेत्रीय विस्तार के कारण है। उत्तरी गोलाध्र्द्ध के पश्चिमी भागों में लवणता 35 में से कम होकर 31 प्रति हजार हो जाती हैए क्योंकि आर्कटिक क्षेत्रा का पिघला हुआ जल वहाँ पहुँचता है। इसी प्रकार 15 से 20 दक्षिण के बाद यह तक 33 प्रति हजार तक घट जाती है। अटलांटिक महासागर की औसत लवणता 36 प्रति हजार के लगभग है। उच्चतम लवणता 15 उत्तर° से 20 उत्तर ° अक्षांश के बीच दर्ज की गई है। अधिकतम लवणता 20 एवं 30 उत्तरी तथा 20 से 60 पष्चिम के बीच पाई जाती है। यह उत्तर की ओर क्रमिक रूप से घटती जाती है। उच्च अक्षांश में स्थित होने के बावजूद उत्तरी सागर में उत्तरी अटलांटिक प्रवाह के द्वारा लाए गए अधिक लवणीय जल केकारण अधिक लवणता पाई जाती है। बाल्टिक समुद्र की लवणता कम होती हैए क्योंकि इसमें बहुत अधिक मात्रा में नदियों का पानी प्रवेश करता है। भूमध्यसागर की लवणता उच्च वाष्पीकरण के कारण अधिक होती है। काले सागर की लवणता नदियों के द्वारा अधिक मात्रा में लाए जाने वाले ताजे जल के कारण कम होती है। हिंद महासागर की औसत लवणता 35 प्रति हजार है। बंगाल की खाड़ी में गंगा नदी के जल के मिलने से लवणता की प्रवृत्ति कम पाई जाती है। इसके विपरीत अरब सागर की लवणता उच्च वाष्पीकरण एवं ताजे जल की कम प्राप्ति के कारण अधिक है।

Oceanic Salinity: लवणता का ऊर्ध्वाधर वितरण

गहराई के साथ लवणता में परिवर्तन आता है, लेकिन इसमें परिवर्तन समुद्र की स्थिति पर निर्भर करता है। सतह की लवणता जल के बर्पफ या वाष्प के रूप में परिवर्तित हो जाने के कारण बढ़ जाती है या ताजे जल के मिल जाने से घटती है, जैसा कि नदियों के द्वारा होता है। गहराई में लवणता लगभग नियत होती है, क्योंकि वहाँ किसी प्रकार से पानी की कमी या नमक की मात्रा में ‘वृद्धि’ नहीं होती। महासागरों के सतही क्षेत्रों एवं गहरे क्षेत्रों के बीच लवणता में अंतर स्पष्ट होता है। कम लवणता वाला जल उच्च लवणता व घनत्व वाले जल के उफपर स्थित होता है। लवणता साधारणतः गहराई के साथ बढ़ती है तथा एक स्पष्ट क्षेत्र, जिसे हैलोक्लाईन कहा जाता है, में यह तीव्रता से बढ़ती है। लवणता समुद्री जल के घनत्व को प्रभावित करती है तथा महासागरीय जल के स्तरीकरण को प्रभावित करता है। यदि अन्य कारक स्थिर रहें तो समुद्री जल की बढ़ती लवणता उसके घनत्व को बढ़ाती है। उच्च लवणता वाला समुद्री जल, प्रायः कम लवणता वाले जल के नीचे बैठ जाता है। इससे लवणता का स्तरीकरण हो जाता है।

Map of The Great Barrier Reef

Map of The Great Barrier Reef

Map of The Great Barrier Reef

Map of The Great Barrier Reef

Map of The Great Barrier Reef. Introduction: The Great Barrier Reef is a natural wonder that captivates the imagination of adventurers, conservationists, and nature enthusiasts worldwide. Spanning over 2,300 kilometers (1,430 miles) along the northeastern coast of Australia, this UNESCO World Heritage Site is the largest coral reef system on the planet. It teems with an incredible diversity of marine life, stunning coral formations, and breathtaking landscapes. To fully comprehend the vastness and splendor of the Great Barrier Reef, an interactive map serves as an invaluable tool. In this blog, we will take you on a virtual journey, exploring the Great Barrier Reef through a captivating interactive map.

Navigating the Interactive Map: The Great Barrier Reef interactive map provides a dynamic and immersive experience for both researchers and casual users. Accessed through various platforms, such as websites or mobile applications, this map allows users to explore the different regions, islands, and features of the reef system. With intuitive controls, zooming capabilities, and interactive overlays, users can dive deep into the reef’s wonders without getting wet.

Map of The Great Barrier Reef

Regions and Islands

Regions and Islands: The Great Barrier Reef is divided into various regions and islands, each with its unique characteristics and attractions. The interactive map showcases these regions, allowing users to explore them individually or as a whole. From the northernmost tip of Cape York to the southernmost reaches of Lady Elliot Island, users can navigate through this intricate ecosystem at the click of a button.

Coral Reefs

Coral Reefs: At the heart of the Great Barrier Reef’s allure are the mesmerizing coral formations that make it an underwater paradise. The interactive map provides a detailed view of the diverse coral reefs, such as the Ribbon Reefs, the Whitsunday Islands, and the Coral Sea. By clicking on specific areas, users can learn about the types of corals present, their significance, and the marine life that thrives in these habitats.

Marine Life

Marine Life: The Great Barrier Reef is home to an astonishing array of marine creatures, from vibrant tropical fish to majestic sea turtles and elusive reef sharks. The interactive map presents an opportunity to delve into the rich biodiversity of the reef system. By selecting designated areas or marine species icons, users can discover fascinating facts, observe stunning images, and even listen to recordings of the reef’s inhabitants.

Conservation Efforts and Threats:

Conservation Efforts and Threats: While the Great Barrier Reef remains a natural marvel, it faces numerous threats, including climate change, pollution, and overfishing. The interactive map serves as a valuable educational tool by shedding light on these challenges and the ongoing conservation efforts. Users can access informative overlays, multimedia presentations, and links to organizations working to protect and preserve this fragile ecosystem.

Conclusion:

Conclusion: The Great Barrier Reef interactive map offers an immersive and educational experience, allowing users to explore the reef’s wonders from the comfort of their homes. It serves as a testament to the power of technology in fostering appreciation for our natural world. By delving into the map’s interactive features, users can develop a deeper understanding of the Great Barrier Reef’s beauty, biodiversity, and the urgent need for its protection. So, let your curiosity guide you as you embark on a virtual adventure through this remarkable natural wonder.


Also Read